
Charles Bull has been conducting “Citizen Science” observations on Electrical Conductivity (a measure of salt content) & Temperature of surface waters at 3 locations in the upper Williams Lake Watershed April 2022 to April 2023 & ongoing.
Comments below are by David Patriquin in consultation with Charles Bull & Melanie Dobson (WLCC); charts are by David P except as noted.
View also The Salt Issue (on this website).
BACKGROUND
In 2015, concerns were expressed by the Williams Lake Conservation Company (WLCC) about possible effects of renewed salting of roads close to Williams Lake on water quality of the lake. Regular salting was replaced by sand and grit in the late 1980s which was maintained until January 2015 when regular salting was re-instigated. A study that I conducted as a volunteer in the late fall of 2015 indicated that salt levels were rising in Williams Lake and that runoff containing road salt in the upper part of Governors Brook and draining an area of Herring Cove Road was the major source of salt entering Colpitt Lake and in turn, Williams Lake.*
*Water quality measurements on Williams Lake and Colpitt Lake (Halifax, N.S.) Dec 7-13, 2015 with reference to possible impacts of road salt. D. Patriquin. 2016. Report to Williams Lake Conservation Company, Halifax, Nova Scotia, 39 pages.
While the regular salting policy was reversed in 2017 to the status quo, that affected only the streets close to Williams Lake, and thus salt inputs originating from the Herring Cove Road area remained a concern.*
*For details, view WLCC Newsletters of 2015, 2016 and 2017
In 2022, Charles Bull volunteered to conduct observations of EC (Electrical Conductivity, a measure of the salt concentration in water) and temperature at three sites on Governors Brook & Colpitt Lake that he visits during his regular walks in the Backlands. Over time, these observations will help us to determine if salt loading is increasing (or not, or decreasing), and could provide insights into the related dynamics, sources etc.
EC and Temperature measurements were made with an HM Digital Aquapro Water Tester AP-2 . More info on its use here.
We are making the original data freely available and we invite others to explore the data, look at relationships to weather data etc. – Charles Bull, David Patriquin Jan 3, 2023
SITE LOCATIONS
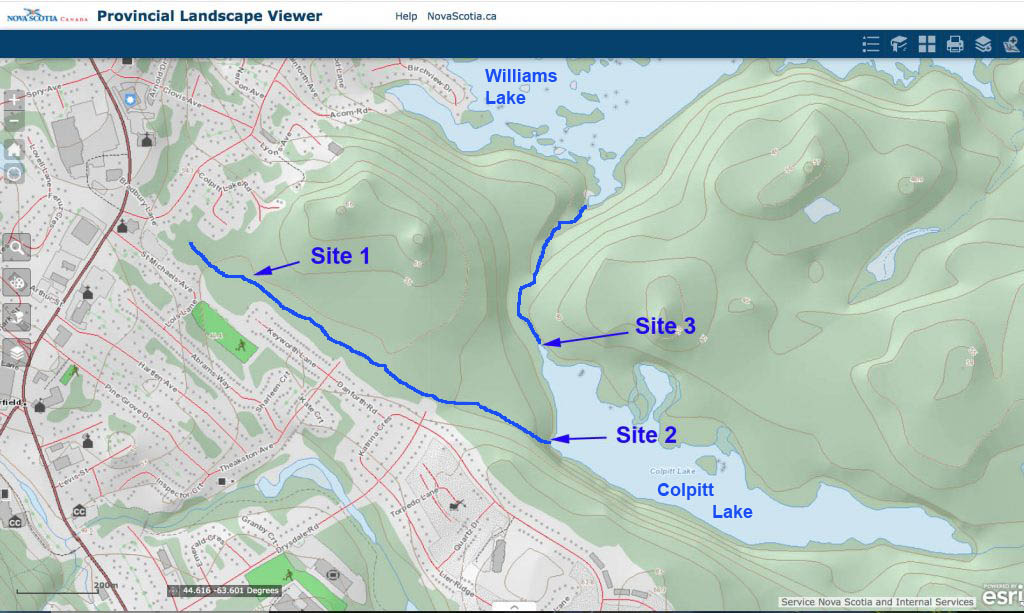
Location of Observations in 2022/2023. Site 1 is in the upper reaches of Governors Brook. Site 2 is at the mouth of Governors Brook on Colpitt Lake. Site 3 is at the top of the un-named stream that drains Colpitt Lake and empties into Williams Lake.
Click on images for larger versions
OBSERVATIONS APRIL 2022 to-APRIL 2023
Data Files:
– CBullWaterData22-04-12to23-04-28.xlsx
– CBullWaterData22-04-12to23-04-28.pdf
Ongoing:
– CBullWaterDataForMay2023.pdf | CBullWaterDataForMay2023.docx
– CBullWaterDataJune2023.pdf | CBullWaterDataJune2023.docx
– CBullOctNov2023WaterData.docx | CBullOctNov2023WaterData.pdf
– CBullWaterDataDec2023-Feb2024.docx | CBullWaterDataDec2023-Feb2024.pdf
– Water Data 24 03
– Water Data 24 04
This is a first blush look at the data. The EC values are those observed in the field; according to the manual, these values are “automatically temperature compensated” so in principle these should be “Specific Conductance” values (measurements made at or standardized to 25 degrees C)*. *Conductivity increases approximately 2-3% per 1°C increase in temperature (Source: Fondriest). In another Citizen Science Project, EC measurements were made in the field, water samples taken and EC measured again after 24 hours at room temperature; the two observations provide some indication of how much temperature/overnight storage affects the values observed with this instrument.
Figure 1. Electrical Conductivity values at Site 1 (upper Governors Brook) on individual sampling days

Each bar shows the EC value for a particular date
View Datafile for individual dates and values.
Click on image for larger version
Comment: In April and May of 2022, Charles noted that plunges in EC values occurred immediately after heavy rains, and this continued through the rest of 2022. The big drops in this figure in most cases occur after high rainfall events recorded at Halifax International Airport – see daily precipitation for April to Dec 2022. After the drops, values tended to climb again until the next big precipitation event.
Melanie Dobson of the WLCC has been monitoring water levels in Williams Lake since 2005 and has commented: “The most significant factor affecting lake level is the amount of rainfall. In the hot summer months of July and August, in the absence of rain, the lake level drops by 2 cm a day mainly due to evaporation. When it does rain, the lake rises by 3 cm for every cm of rain received.” Source; see also 2023 Newsletter). Her charts show a fairly quick increase in lake water after larger rainfall events – because of the generally shallow soils over hard bedrock, water entering in larger precipitation events saturates the soil quickly and then moves quickly from land to surface waters. Melanie suggests that the gradual increase in EC values over Aug and Sept to values higher than observed in the spring (Fig 1. above) is related to summer doughtiness – salt concentration increases as water is evaporated from the soil. A plot of the EC data for April to Dec 2022 together with temperature and daily rainfall for the Halifax area (Fig 2 below) shows clearly the trends of increasing salt concentration between rainfalls.
Fig 2. Maximum air temperature (top), EC at Site 1 (middle), and Daily Rainfall April to December 2022.

Chart prepared by Melanie Dobson
Melanie comments: “Highest salt levels in Governor’s Brook from May-Dec, 2022 correspond to hot dry weather in late summer.”
Other factors that could contribute to the high EC values in Aug and Sept are a delayed groundwater/soil retention salt signal* and runoff of fertilizers applied to gardens and lawns in spring and summer. Info. on the chloride and potassium levels could help to determine whether there is a “fertilizer signal”.
* i.e., some of the salt applied in winter is stored in soil and groundwater first and moves more gradually into surface waters downstream – see for example Long-Term Sodium Chloride Retention in a Rural Watershed: Legacy Effects of Road Salt on Streamwater Concentration by Kelly et al., 2007 in Environ. Sci. Technol. A similar late summer/early-to-mid fall peak was observed for stream waters entering Sandy Lake (Bedford), revealed in another Citizen Science salt monitoring project.
Overall the EC values declined from the first observations in April 2022 to the end of the year (Figs 1 & 2, above). It was a generally warm late fall/early winter and very little if any road salt was applied during that interval. Stream EC changed dramatically on Jan 5, 2023 (Fig 1) when EC values literally went off the chart – the EC meter maxed out at 9999 uS/cm!* (The values on Jan 1, 3 & 4, 2023 were 331, 441, 314 uS/cm). Obviously winter salting had begun! On January 10, 2023, EC had dropped to 1189 uS/cm. Over the rest of January through February, there was an overall trend of increase, with similar spikes, 3 of them exceeding 10,000 uS/cm. The highest value was 20,105 uS/cm, on Mar 1, 2023. On Mar 2, EC had dropped to 2864 uS/cm. So it appears the salt is moving as a kind of slug or parcel down Governors Brook.
* The next very high value (>9,999) was on Jan 21. On that occasion, C.B. followed a procedure I had suggested if he encountered another >9,999 value to get an estimate of the actual value – see Procedure; the estimated value was 11, 497 uS/cm.
Full strength seawater is about 50,000 uS/cm. So water in Governors Brook on the high EC days was the equivalent of about 20-40% seawater. The Canadian Water Quality Guidelines for the Protection of Aquatic Life for chloride are 120 mg CL/L for Long term Exposure and 640 mg CL/L for short term exposure; the equivalent EC values are 474 and 2414 uS/cm respectively (source). On the days when EC exceeded 9,999 uS/cm, the chloride values were likely at least 5 x the critical value for short term exposure!
Charles says there were only a 3 major salting days in 2023 and he thinks he “caught” them all with his sampling, the values close to 10,ooo uS/cm and above corresponding to major salting days.
Figure 3. Electrical Conductivity values at the three sites on individual sampling days
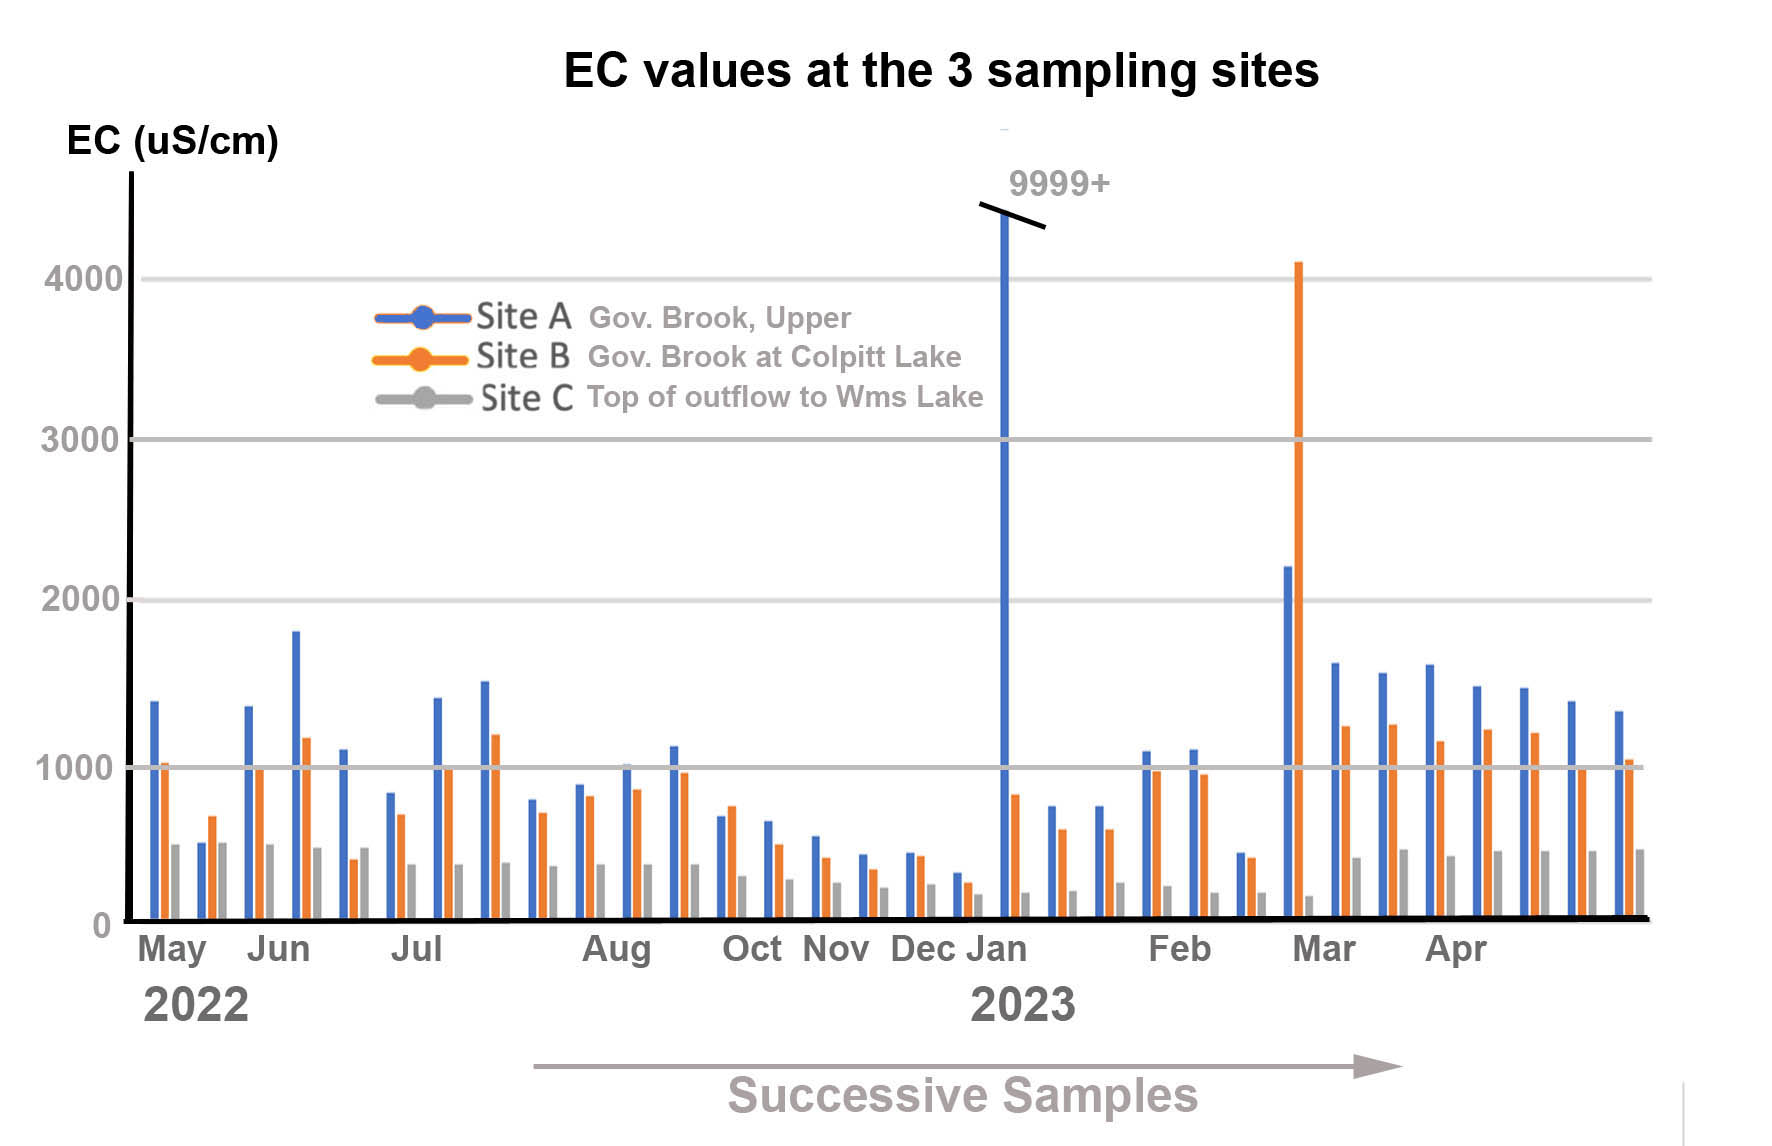
There are fewer samples than in Fig 1 because fewer measurements were made at Sites B & C than at Site A.
Comment: The lower values at Site 2 compared to site 1 illustrate dilution of salts at site 1- which is at the edge of the settled area – as the water passes through unsettled, wild land to the mouth of Governors Brook into Colpitt Lake.
The lower still, and less erratic values at Site 3 (the top of the un-named stream that flows between Colpitt and Williams Lake) illustrate the further dilution of the Governors Brook salts by streams flowing into Colpitt Lake from unsettled, wild lands. There is some additional dilution as the water flows between Colpitt Lake and Williams Lake, see figure below (from a previous study).
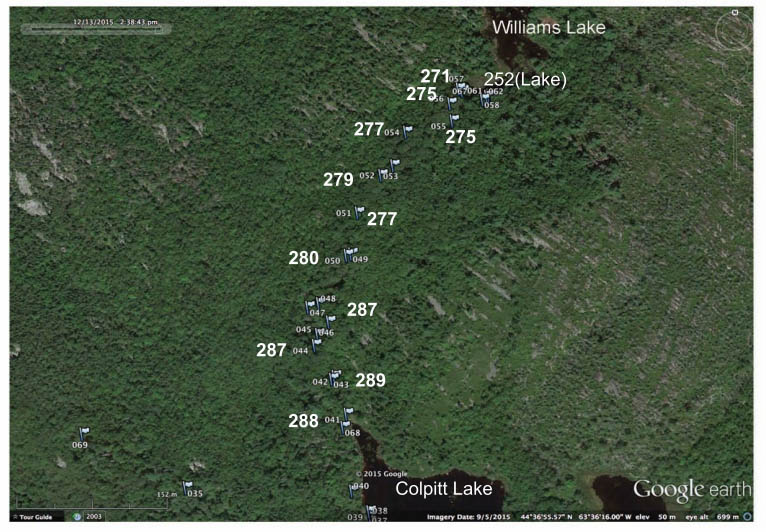
Figure 4: Specific Conductance values (uS/cm) on the stream running between Colpitt Lake and Williams Lake on Dec 13, 2015. From Fig 5 in 2016 report.
In contrast to the general trend for values to decline in the order Site A to Site B to Site C on individual days, on Mar 3, 2023, the value at Site B was approx. twice that at Site A, and both values were high. (Values were 2864, 4525, 487 uS/cm for Sites A, B & C respectively.) The high EC value at Site B compared to Site A could be due to salt moving as a kind of slug or parcel down Governors Brook and on that occasion the slug had already moved past Site A. Charles suggested another explanation: that it was due to input of salt from the area of Drysdale and/or Theakston Ave – the ends of those streets lie within the Williams Lake Watershed:

Screen Capture from the NS Groundwater Atlas showing McIntosh Run Watershed Boundary. The circled area is within the Williams Lake Watershed. Locations of Catchment Basins can be viewed on a Halifax Water Map
IN CONCLUSION: Highlights & Questions
Highlights:
(i) The close-to-daily measurements (Figure 1 above) illustrate the high variation in daily values; as might be expected, EC drops after heavy rains. This sort of variability illustrates the need to sample a stream (versus a lake) repeatedly to represent the salt level for a particular time of year, e.g. samples might be taken daily or every second day over 2 weeks. Alternatively, automated sensors (e.g., the Levelogger® 5 LTC) could be installed, but this is much more expensive. There is also some satisfaction and piquing of interest in doing a single measurement and seeing the result right away, and repeating it over time versus maintaining a data-logger instrument and later downloading the data.
(ii) The values for the three sites shown in Figure 3 illustrate the progressive dilution of salts that were present in Governors Brook at Site 1- near to settled areas – as the stream goes through wild (unsettled land) and enters Colpitt Lake at Site 2; and then the further dilution that occurs between the mouth of Governors Brook and the top (Site 3) of the un-named stream that goes from Colpitt Lake to Williams Lake. As shown from the 2015 data in Fig 4, the salt in Colpitt lake water is further diluted as it moves down the corridor to Williams Lake.
(iii) Governors Brook is likely the only significant source of road salt going into Colpitt Lake (see 2016 Report.); salt entering Williams Lake from Governors Brook is diluted by surface and ground waters coming from wild lands around Colpitt Lake as well as precipitation over the lake. The Site 3 values are much less variable day to day than the Governor Brook values, reflecting the ‘buffering’ by the large volume of lake water.
(iv) On some days in winter, the salt concentration at Site A on Governors Brook was equivalent to 20-40% full strength seawater, and likely exceeded the guidelines for short term exposure to chloride for protection of aquatic life by 5 to 10 fold.
Some questions:
– Has salt content been increasing over time to date? There are some historical data available to help us address this question. See The Salt Issue: Reports related directly to Watersheds associated with the Backlands.
– Are salt levels increasing into the future? Continued monitoring as conducted by C.B. would help us to answer this question!
– How are current salt loadings affecting Colpitt and Williams Lakes? We really need limnological profiles (temperature, EC, and oxygen) at the deepest points in each of Colpitt Lake and Williams Lake in the spring, summer and fall (winter would would also be nice) over several years to determine whether salt is accumulating in deeper layers and possibly inhibiting normal spring turnover; also to assess oxygen levels. See A DRAFT Report On the State of Sandy Lake, the Historical Trends and its Future Trajectory for further discussion of the salt issue in relation to a local lake with salt values similar to those in Colpitt Lake and Williams Lake.

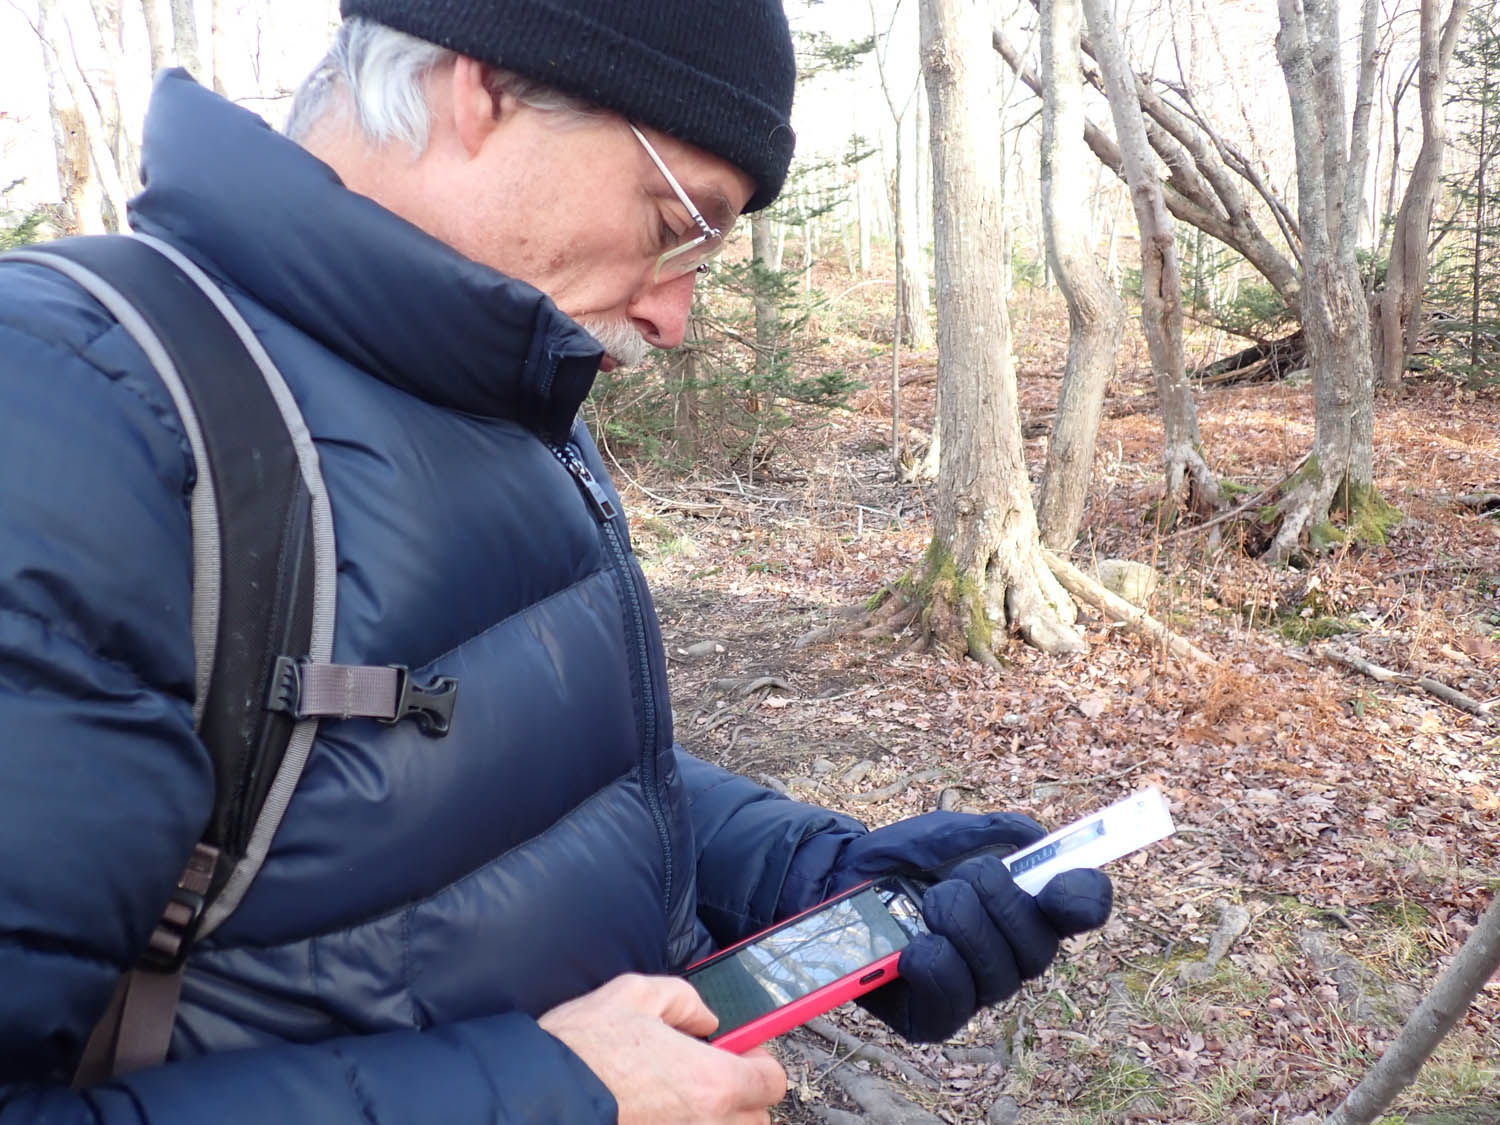
Sampling at Site 1 Nov 30, 2022 – Readings
Sampling at Site 1 Nov 30, 2022: Recording the readings
Page posted by David P Jan 2, 2023.
Major revision on May 14, 2023. View earlier version (Results to end of 2022 only)
Observations for May 2023 added June 16, 2023